Observability | aduno® Campus Details

Use monitoring at management level to better allocate human resources and resolve problems faster! The Observability functions of aduno® Campus for large-scale distributed systems measure the internal states of your system and show the causes of problems.

  • In addition to the basic features (right), aduno® Campus:

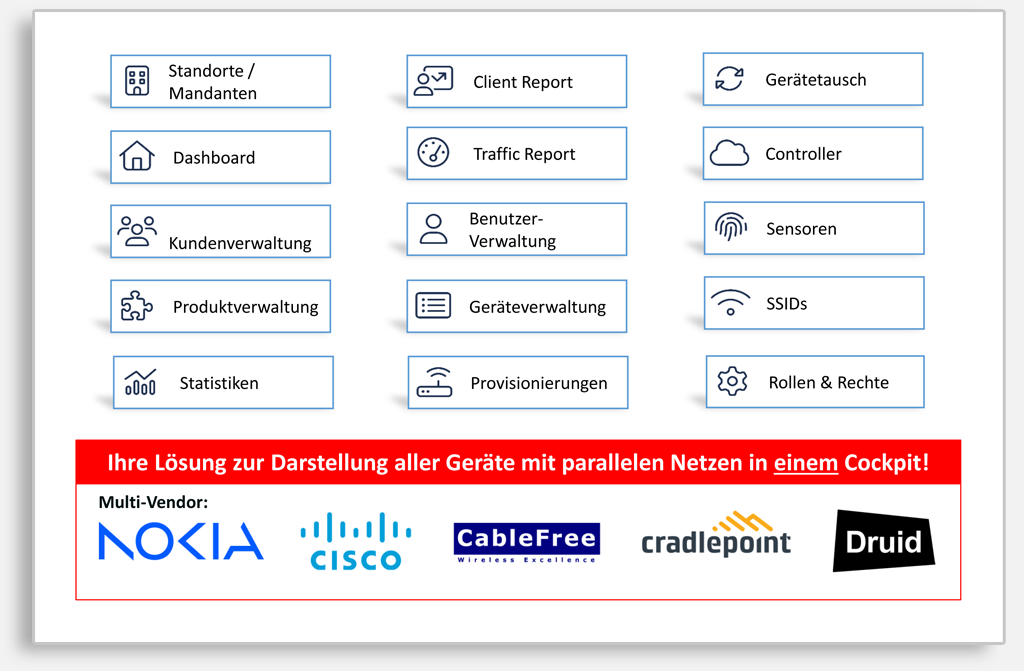
    • Basic checks & observability
    • Extensive alarming functions
    • Statistics available for end customers for 90 days
    • Open API for e.g. Service Now, SAP, Salesforce, FMTB etc.
    • Ticket connection
    • Access/login for venue owners
    • Customer services with e-mail notification
  • Accessibility

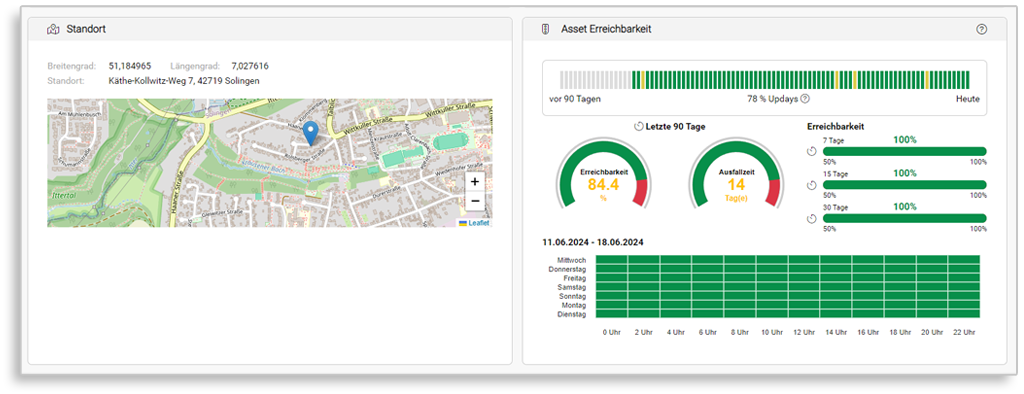
    Our accessibility widget is used for various assets and services. It shows the current status and a history of up to 90 days. The availability times for the last 7 days are displayed every two hours, giving you an optimal overview of the status of the device.

  • Availability

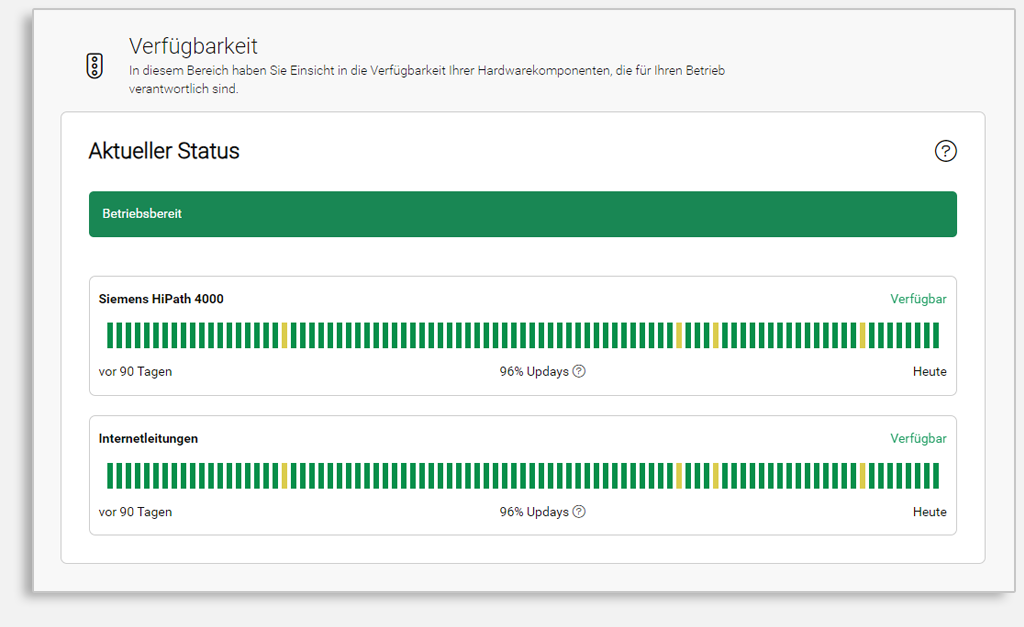
    Availability is the amount of time a device, service or other part of the IT infrastructure is usable – or whether it is available at all. Since availability or system uptime indicates whether a system is functioning normally and how effectively it can recover from a crash, attack or other type of failure, availability is considered one of the most important metrics in information technology management.

  • Telemetry / Sensors

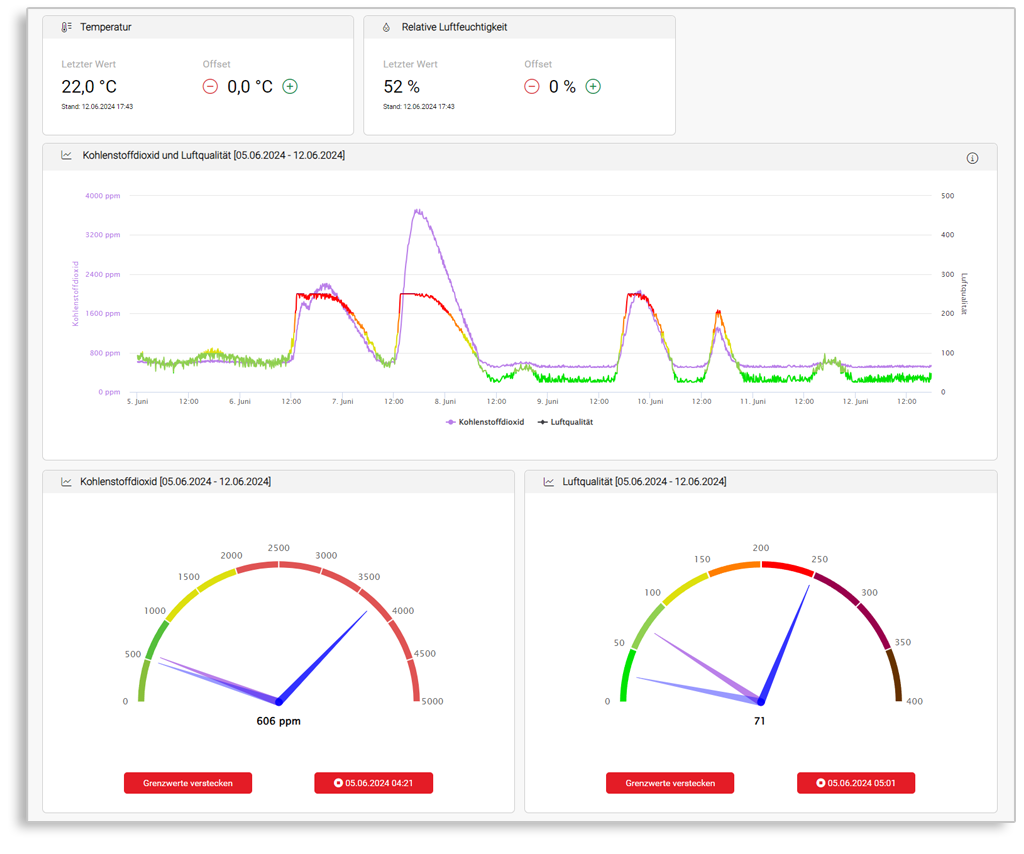
    The aduno® platform enables the connection and management of a large number of sensors and offers functions such as data visualization, alarming and data analysis.

    Part of our philosophy is to give customers visibility of all their assets, regardless of network type. We therefore offer special widgets for sensors that have been tested with numerous sensor types from various well-known manufacturers.

  • Service Monitoring

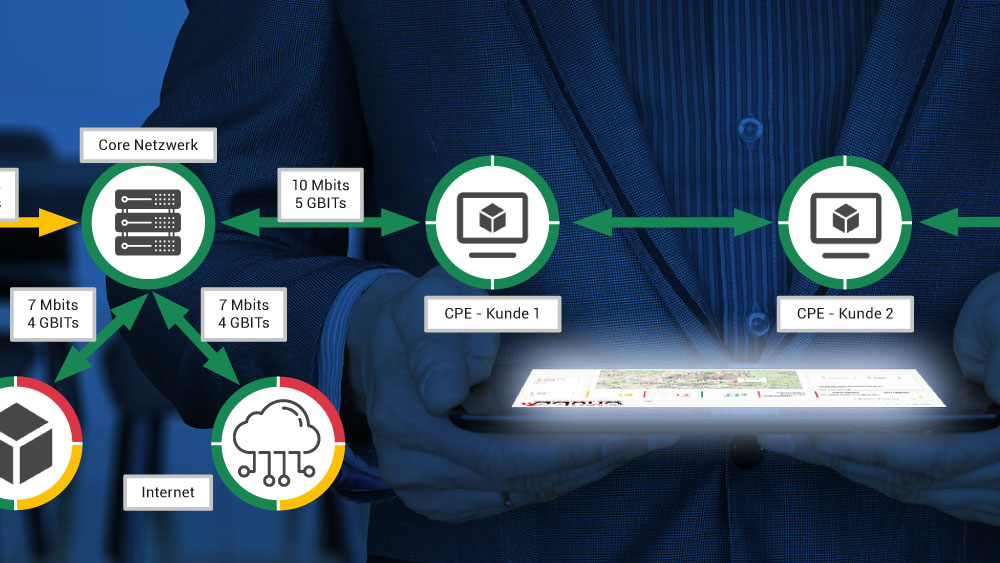
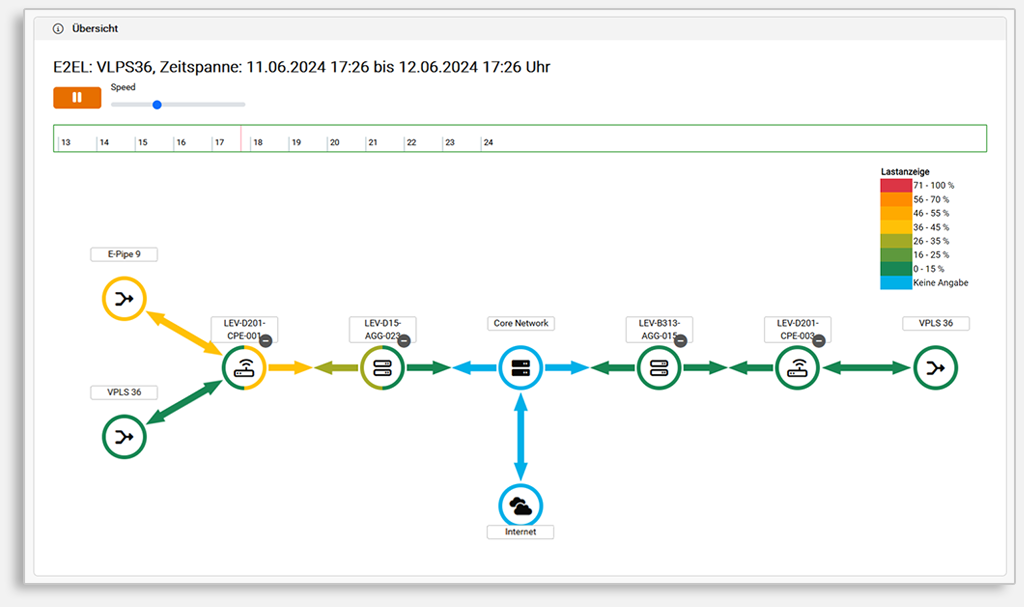
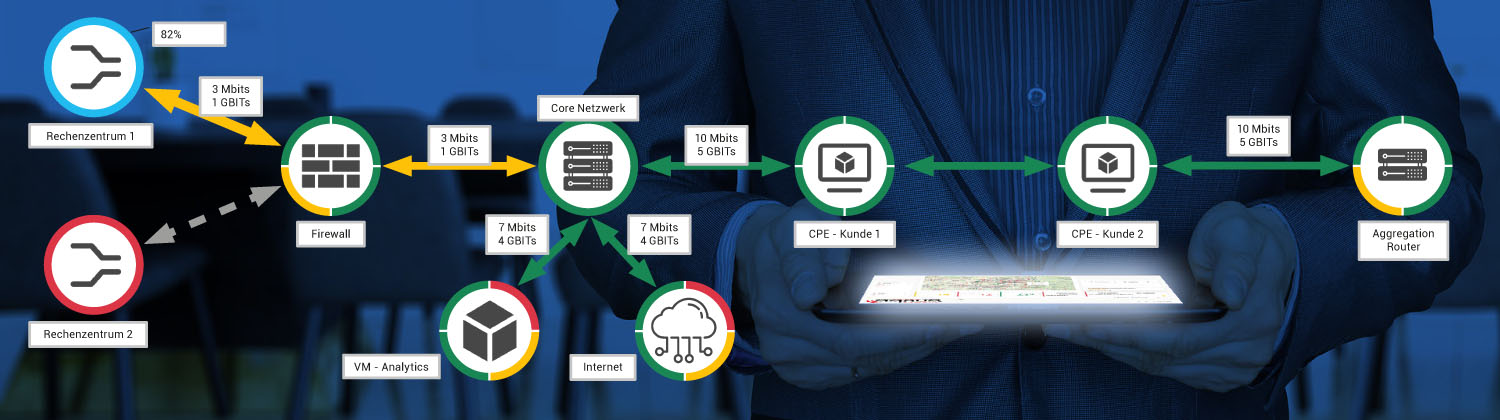
    This visualization provides insights into all service interactions, derived services, dependencies and performance. The performance is visualized by the colored arrows, which – as an animation or at selected times – show the performance of the last 24 hours.

    Global services or individual customer services can be defined.

  • Network Overview

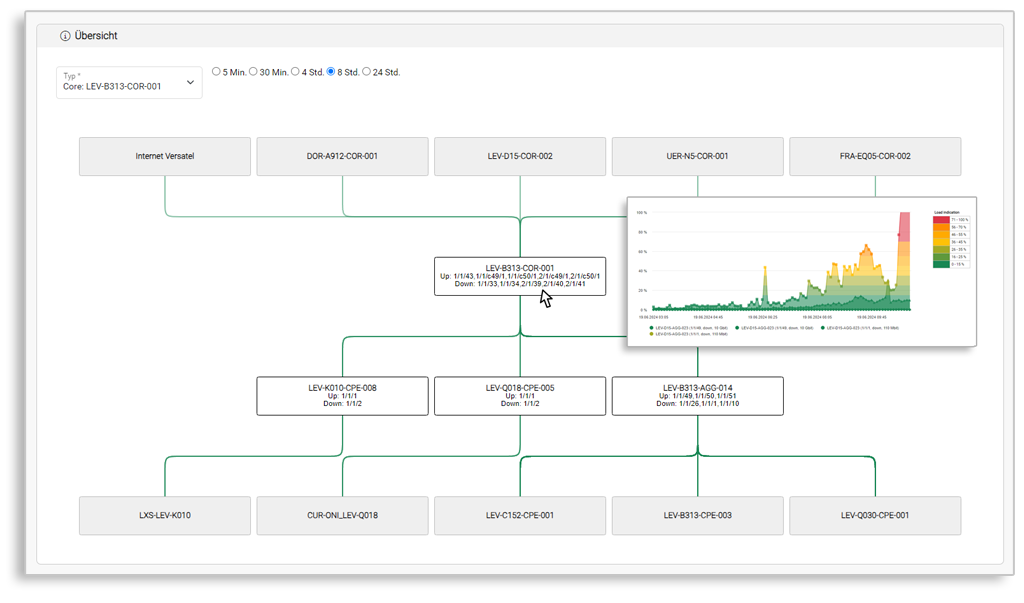
    The visualizations of e.g. infrastructures, servers, ports or processes show the current status of the individual hosts and services. More detailed additional information is provided by tooltips and diagrams.

    There are many customization options for the Weathermap. You can use the Weathermap to identify dependencies, performance bottlenecks and error propagation.

  • Operating times & SLA monitoring

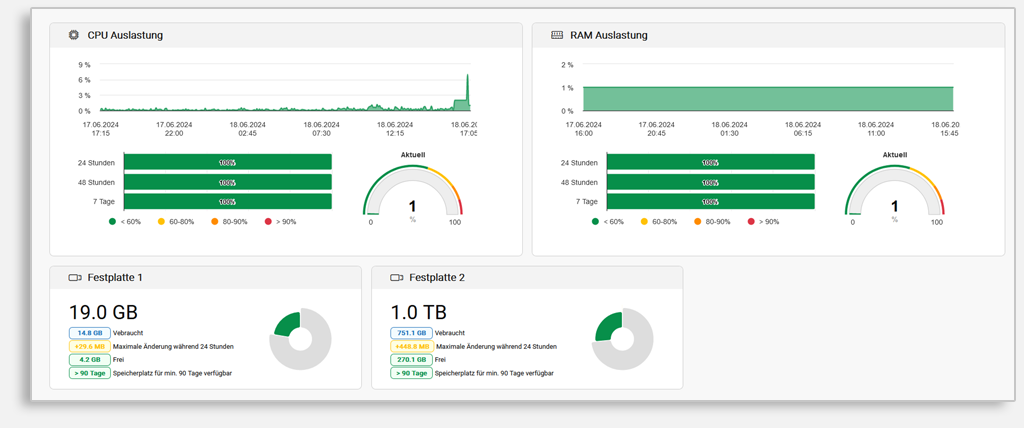
    Regularly monitor the CPU utilization of your systems to ensure that it is within acceptable limits. Set CPU utilization thresholds to trigger alarms. Define clear Service Level Agreements (SLAs) for your systems that define expected uptime and performance.

    Similar to CPU utilization, it is important to monitor the RAM utilization of your systems. With aduno® Campus, you can take measures to optimize RAM utilization and avoid bottlenecks.

  • Port Status / Service Alarming

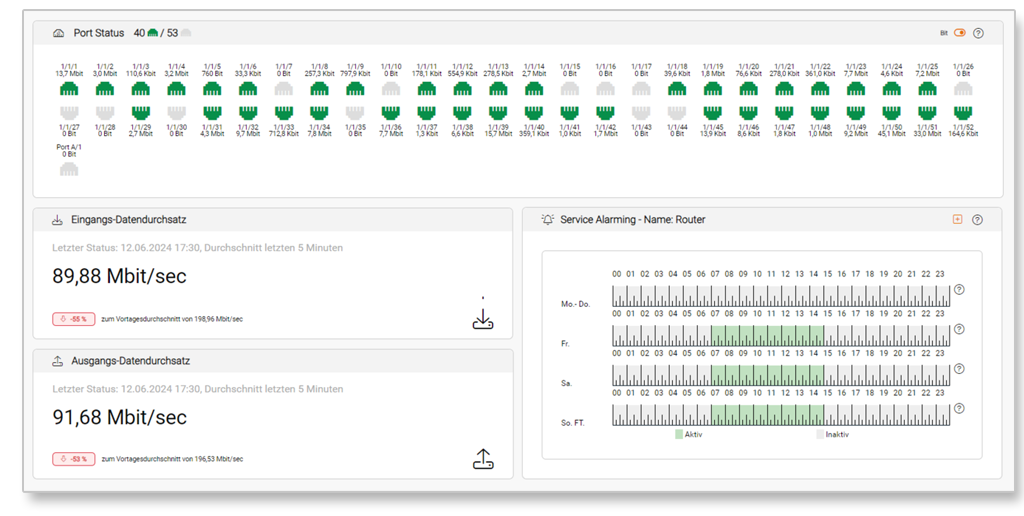
    The Port Statistics Dashboard provides you with the information you need for preventive troubleshooting of network lines or end device connections, thus increasing the availability and reliability of your network.

    Service Alerting is responsible for proactively monitoring and ensuring the availability and reliability of services. By configuring appropriate alerts, teams can stay informed of critical events, anomalies or performance degradation and take immediate action and resolve issues efficiently.

  • Locations and geotargeting

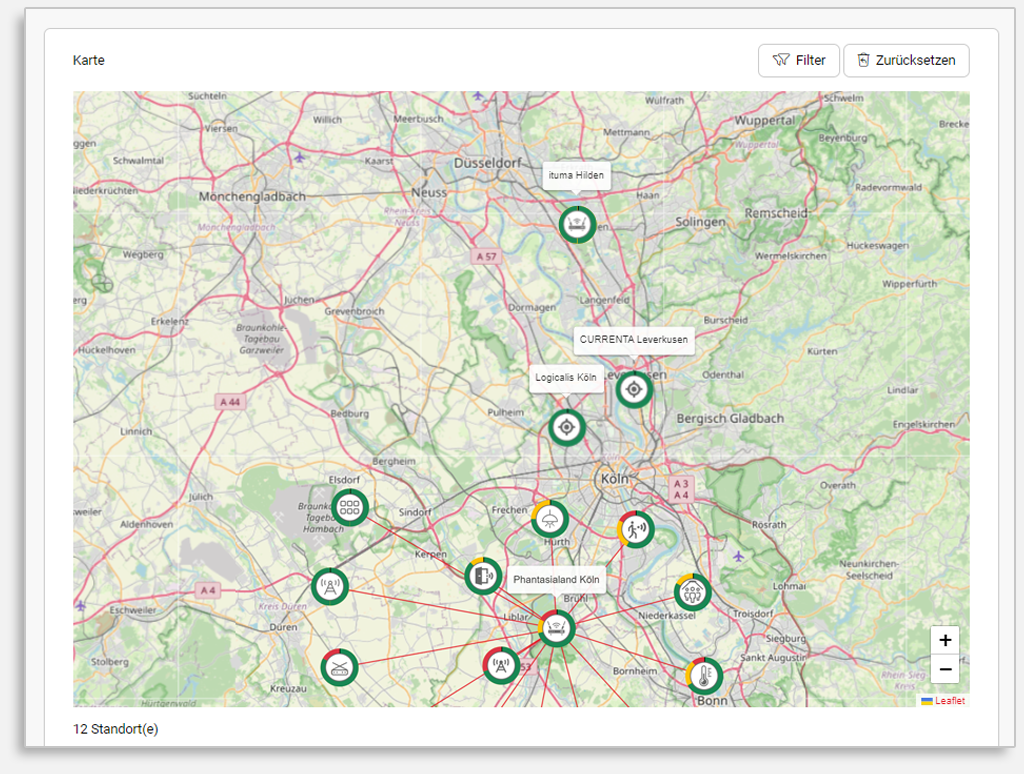
    By monitoring locations, you can monitor the availability and performance of your systems from different geographical regions. Location-based monitoring allows you to control the network connections and latency times between different locations. This is particularly relevant if you use distributed systems or cloud infrastructures.

    The customer and client structure of aduno® allows you to set up separate customer portals for regional business units, enabling site employees to react quickly and effectively.

  • Filter functions

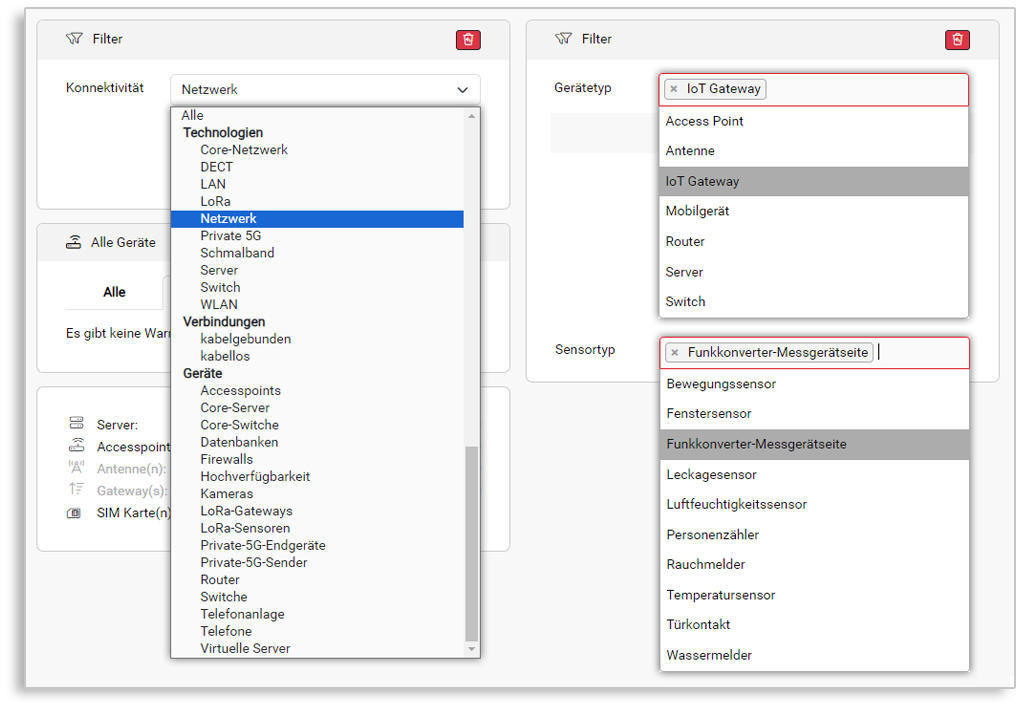
    Both on the dashboard and in many other places in the portal, you have the option of filtering the view according to your requirements. This allows you – or your customers/departments – to put together your own customized dashboard.

    By using the filters, you can focus on specific aspects or categories that are important for your analysis or monitoring. This enables a more targeted and efficient examination of data.

In addition, aduno® Campus includes all the functions of aduno® carrier.